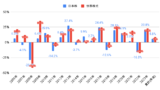
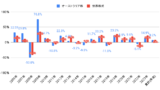
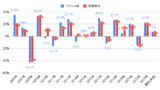
国別株式リターンランキング
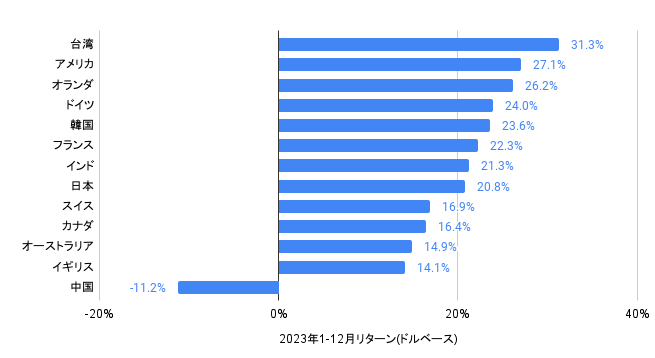
以下のグラフは、2023年の主要13ヶ国の国別株式リターン(以下、MSCI、ドル建て)となります。
2023年の第1位は台湾(+31.3%)、第2位はアメリカ(+27.1%)、第3位はオランダ(+26.2%)だった一方、ワーストは中国(▲11.2%)です。
市場全体(ACWI)のリターンが+22.81%だったため、市場平均を上回った国は4ヶ国のみです。
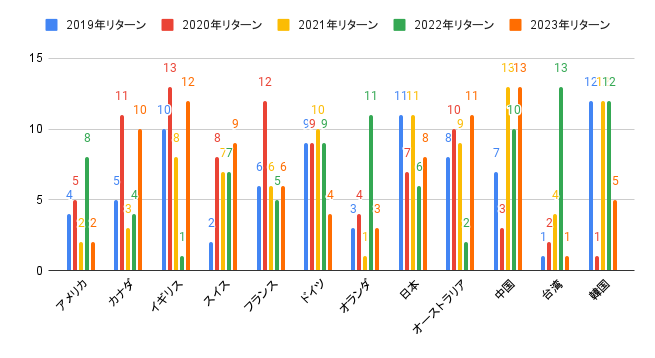
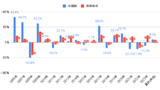
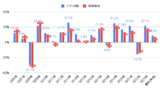
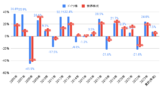
以下のグラフは、過去5年間の主要国のリターンランキングとなります。
過去5年間では、アメリカ、台湾、オランダが平均上位だった一方、中国、イギリス、日本が平均下位となりました。
国別バリュエーション
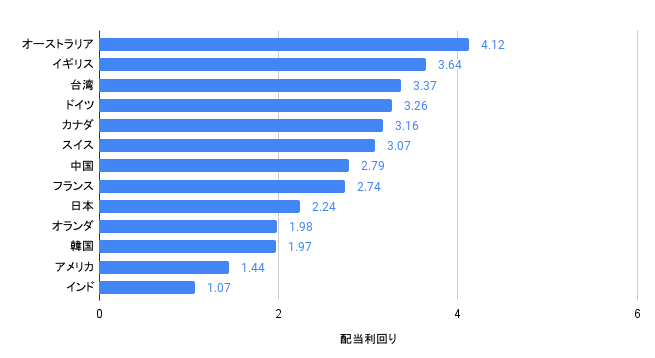
配当利回りランキング(2023年12月末)
以下のグラフは、主要国の国別配当利回りランキングとなります。
第1位はオーストラリア(4.12%)、第2位はイギリス(3.64%)、第3位は台湾(3.37%)です。
配当利回りが相対的に高いエネルギーと金融セクターに強い国が、上位になりやすい傾向にあります。
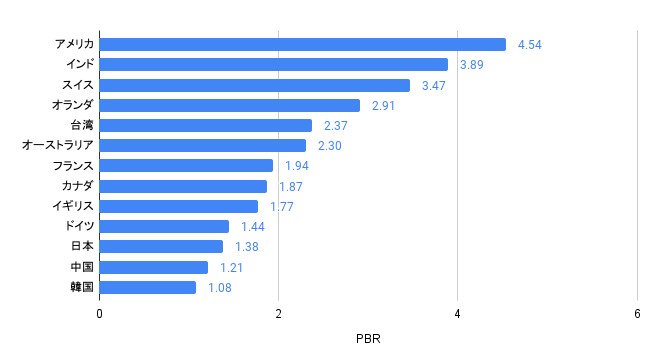
国別PBRランキング(2023年12月末)
以下のグラフは、主要国の国別PBRランキングとなります。
アメリカ(4.54倍)が最も高く、韓国(1.08倍)が最も低い水準です。
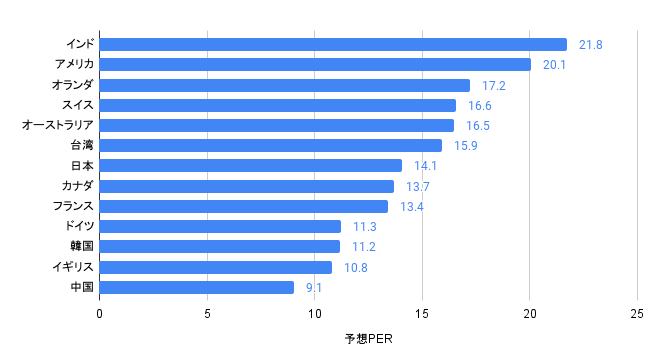
国別予想PERランキング(2023年12月末)
以下のグラフは、主要国の国別予想PERランキングとなります。
インド(21.8倍)とアメリカ(20.1倍)が相対的に高く、中国(9.1倍)が最も低い水準です。
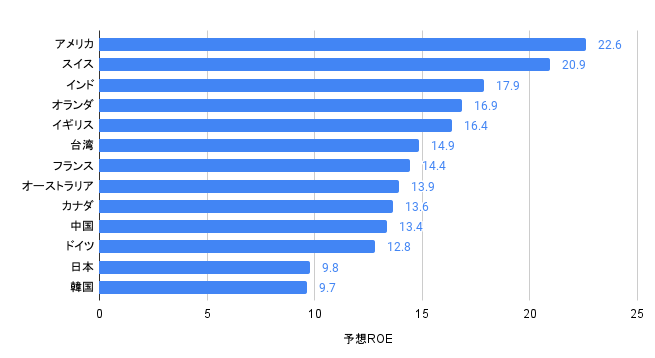
国別予想ROEランキング(2023年12月末)
以下のグラフは、主要国の国別予想ROEランキングとなります。
第1位はアメリカ(22.6%)、第2位はスイス(20.9%)、第3位はインド(17.9%)です。
https://lloydy-investment.com/equity-netherland/
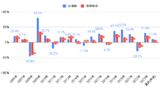
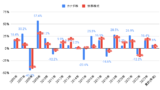
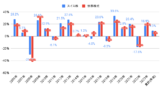
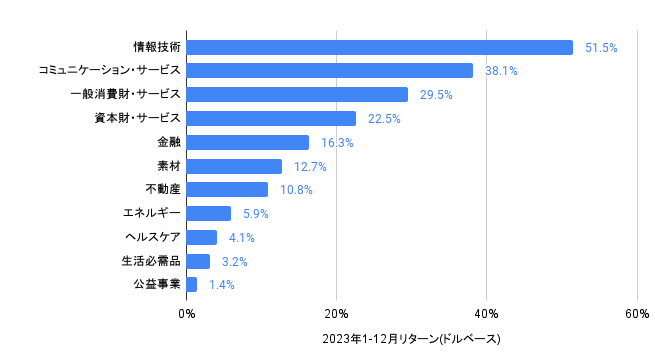
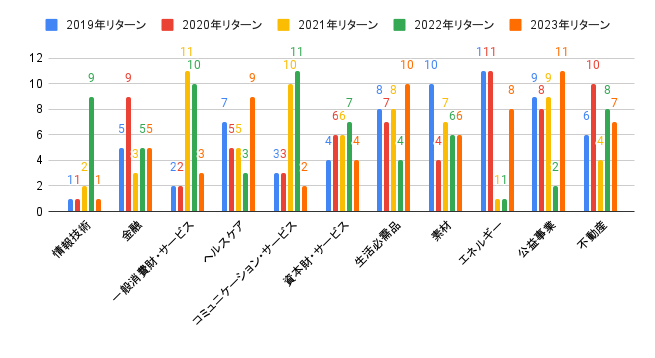
セクター別株式リターンランキング
以下のグラフは、2023年のセクター別株式リターンとなります。
2023年の第1位は情報技術(+51.5%)、第2位はコミュニケーション・サービス(+38.1%)、第3位は一般消費財・サービス(+29.5%)だった一方、ワーストは公益事業(+1.4%)です。
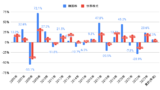
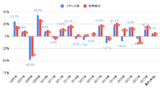
以下のグラフは、過去5年間の11セクターのリターンランキングとなります。
過去5年間では、情報技術がダントツで平均トップだった一方、公益事業、生活必需品、不動産が平均下位となりました。
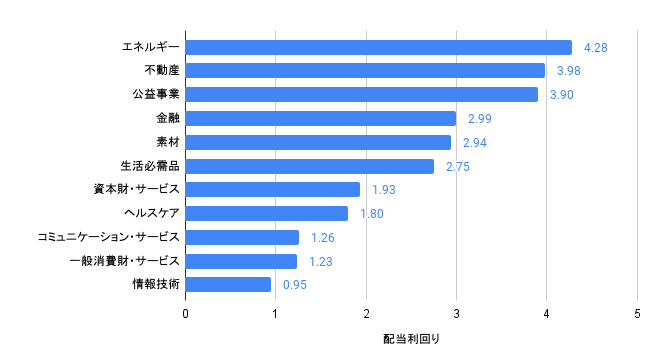
セクター別バリュエーション
配当利回りランキング(2023年12月末)
以下のグラフは、世界株式のセクター別配当利回りとなります。
第1位はエネルギー(4.28%)、第2位は不動産(3.98%)、第3位は公益事業(3.90%)です。
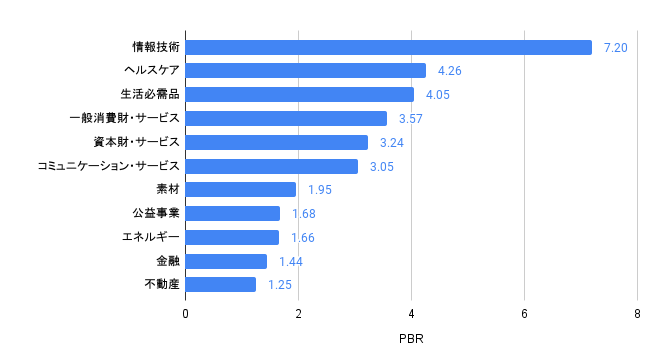
セクター別PBRランキング(2023年12月末)
以下のグラフは、世界株式のセクター別PBRとなります。
情報技術(7.20倍)が最も高く、不動産(1.25倍)が最も低い水準です。
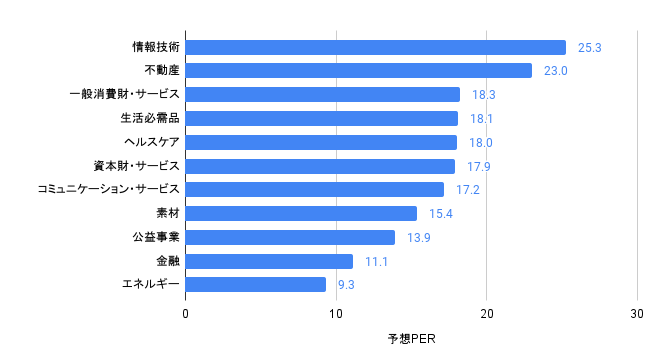
セクター別予想PERランキング(2023年12月末)
以下のグラフは、世界株式のセクター別予想PERとなります。
情報技術(25.3倍)が最も高く、エネルギー(9.3倍)が最も低い水準です。
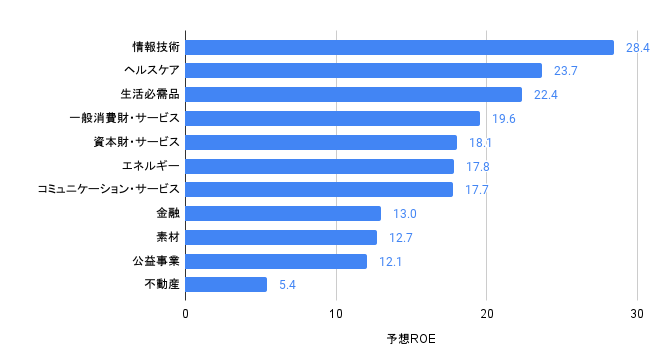
セクター別予想ROEランキング(2023年12月末)
以下のグラフは、世界株式のセクター別予想ROEとなります。
第1位は情報技術(28.4%)、第2位はヘルスケア(23.7%)、第3位は生活必需品(22.4%)です。